
The Yearly picture of the Dow Jones Futures (chart1) shows long term signs of strength. Since year 2009, each year is making a Higher Low, and although we are in a big range for the last 3 years, the strong attempts to make a Yearly Low have failed so far. In addition, it leans on a climbing fast exponential moving average (8EMA, purple), a very bullish picture. Pay attention to the extension levels of the whole 2008-2009 collapse. The price took out the 138.2% extension level easily, possibly aiming for the next considerable extension level, 161.8% at 19087.
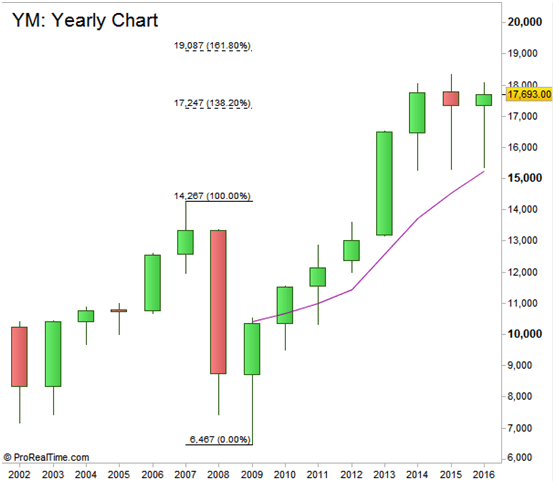
Chart1: Dow Futures Yearly chart (at the courtesy of prorealtime.com)
The Quarterly chart (chart2) shows another important sign of strength, as the high of April (point B) is higher than the high of the bearish quarter of Jul-Sep 2015 (point A), which the last two quarters remained inside its range.
However, to dampen the enthusiasm a little bit, unless the price takes the All Time High, it shouldn’t be surprised to see it tests again the low of the range, as the inner price action has already taken out a major Last Low Before High (the red line). A decline back to the mid range is very likely to happen within the current Quarter (May and June).
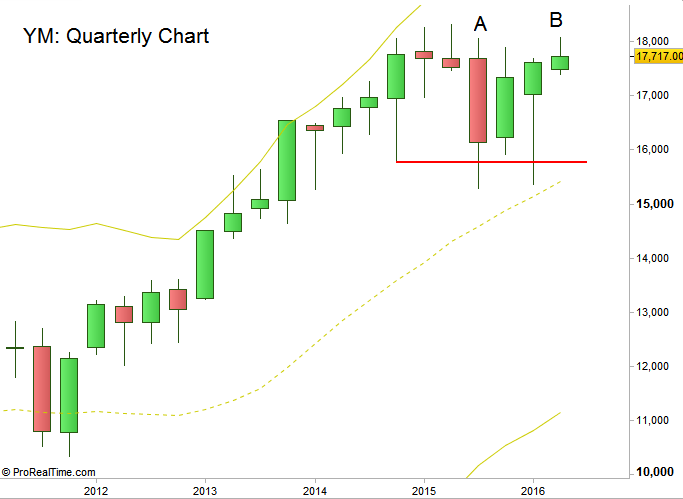
Chart2: Dow Futures Quarterly chart (at the courtesy of prorealtime.com)
The Weekly chart (chart3) shows a possible setup that can potentially emerge within the following two weeks. Taking out the low of the last week, then a corrective rally that won’t take out the high of point B and back to breaking down the low created in the above scenario is a bearish signal to the 17000 area at the mid Bollinger Bands (yellow).
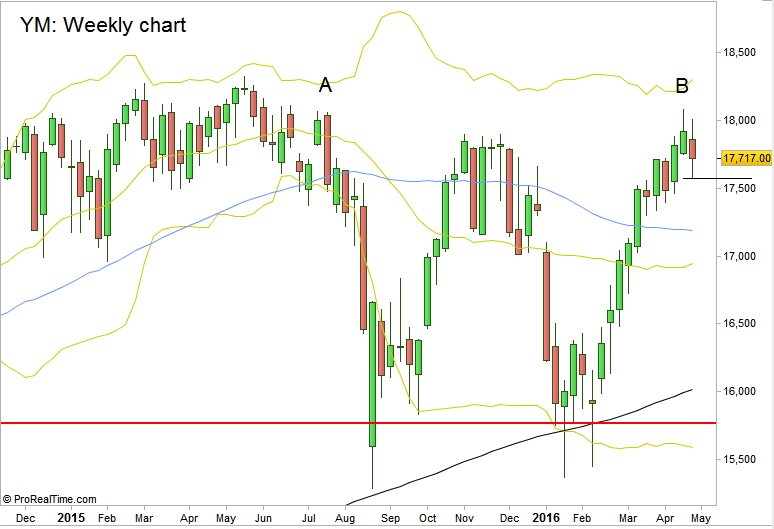
Chart3: Dow Futures Weekly chart (at the courtesy of prorealtime.com)
Disclaimer: Anyone who takes action by this article does it at his own risk and understanding, and the writer won’t have any liability for any damages caused by this action.