
Over the passing week, the Dow, like the SP500 has made a new all time high. This current Quarterly reversal up since the Lows at the 15300 level area can be considered as Elliott Wave 5 of the whole bullish market since March 2009.
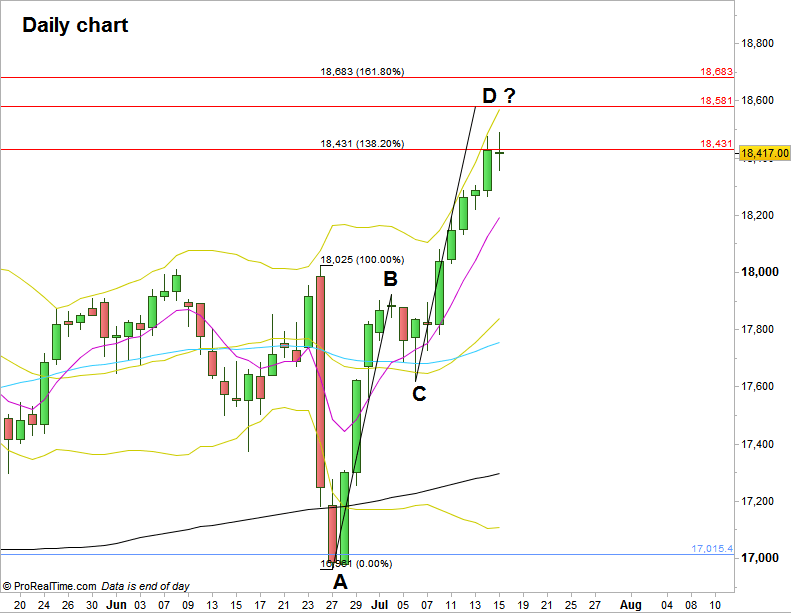
On the Daily timeframe, the price is facing currently the resistance of reaching the 138.2% extension level of the last bearish move (the BRexit reaction).
Since the weekly bar has penetrated the upper Bollinger band considerably, it is wiser not to look for bearish opportunities (for the Daily timeframe and above). If the market is really bearish for the midterm, let it first show you a contra bearish Weekly bar at least. Even an inside bearish Weekly bar for the coming week probably should still touch the upper band, so that it won’t resemble signs of weakness, but a consolidation perhaps for going higher later on.
As mentioned in the previous review, the current bullish setup for the Dow futures points at 19100 level as the target, while the stop is below the Monthly swing Low, 16961.
Any consolidation and sideways action here can give next week a good continuation opportunity with a break up to new highs. Any Daily corrections to the 8 EMA line that end up with a reversal pattern such as pinbars or Engulfing pattern can be taken advantage of, for joining the uptrend.
However, pay attention to the 18580 level, as it is the target for AB=CD pattern the market might already be in. This level, and up to 18680 ( the 161.8% extension of the last BRexit bearish move) might be a midterm resistance for a bigger correction, before probably going higher at least to the target of the current bullish setup at 19100.
Dow Futures: Daily chart (at the courtesy of prorealtime.com)
Disclaimer: Anyone who takes action by this article does it at his own risk and understanding, and the writer won’t have any liability for any damages caused by this action.