
Like in most of other stock markets, the passing week printed a narrow range bar for the Dow. It was a HH HL Weekly bar, totally outside the upper Bollinger band, so the bullish momentum currently is still very high.
The price has reached the level of 18565 which is practically the AB=CD pattern’s target mentioned in the previous review, and the daily reaction followed formed a small bearish setup that might be triggered by taking out the Low of Thursday (depending that the market didn’t make a Weekly HH prior to this trigger). The target for this setup is near, at the 18300 level area.
But, in such a strong momentum up on the Weekly, usually the first countertrend signal on the Daily is more likely to fail and to mislead. So, on the other hand, a Daily bar that takes out the Low of Thursday but closes rather strong can point out that it would be a faked break. Buying a HH above such a Daily bar would be a good Long signal to continue the bullish momentum to the Monthly upper Bollinger Band , at the 161.8% extension of the Brexit reaction, 18683.
If the above scenario of a faked break down doesn’t occur, then taking the Weekly High is a bullish setup to reach the same levels.
An important indication is to notice whether the market is going to close the Monthly bar penetrating the upper Bollinger band closing strongly on the top, or just touching the band in order to reverse, and close weaker.
Pay attention tough that if the market closes the Monthly bar by the end of the coming week without even touching the Monthly upper Bollinger band, it should be refered to as a sign of weakness.
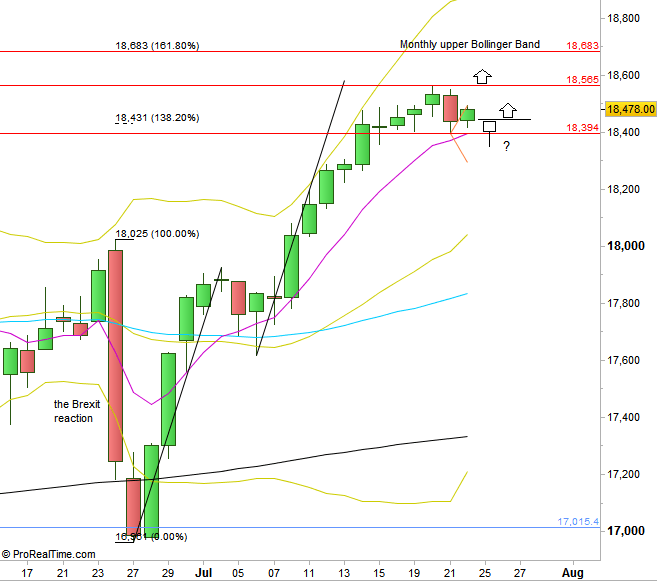
Dow Futures: Daily chart (at the courtesy of prorealtime.com)
Disclaimer: Anyone who takes action by this article does it at his own risk and understanding, and the writer won’t have any liability for any damages caused by this action.