
The month of August has closed as a Doji much below the upper Bollinger Band than should expected in true bullish cases. This is a sign of weakness for the midterm, although the market has currently series of bullish signals and targets, the longer distance targets might be achieved only after a serious correction.
During most of the passing August, the market has built a bearish setup on the Daily timeframe, currently turned out to be a false thrust down.
Taking out the High of Friday is a bullish signal due to a negation of this bearish setup, and is pointing towards 18780 for a target, very closed to the 161.8% extension of the last Monthly reaction made since April till June this year. This level is also the target for the Weekly bullish pinbar made by the first week of August. So, three different setups point to the same area, of 18775-18780.
Approaching that target in September wont let the price touch the Monthly upper Bollinger Band (as opposed to the case the market would have already achieved that target in August), and may turn to be a major sign of weakness for the midterm.
Notice that the inner price action of passing August is not so bullish, and there are less chances for a strong momentum move that would reach the target rapidly.
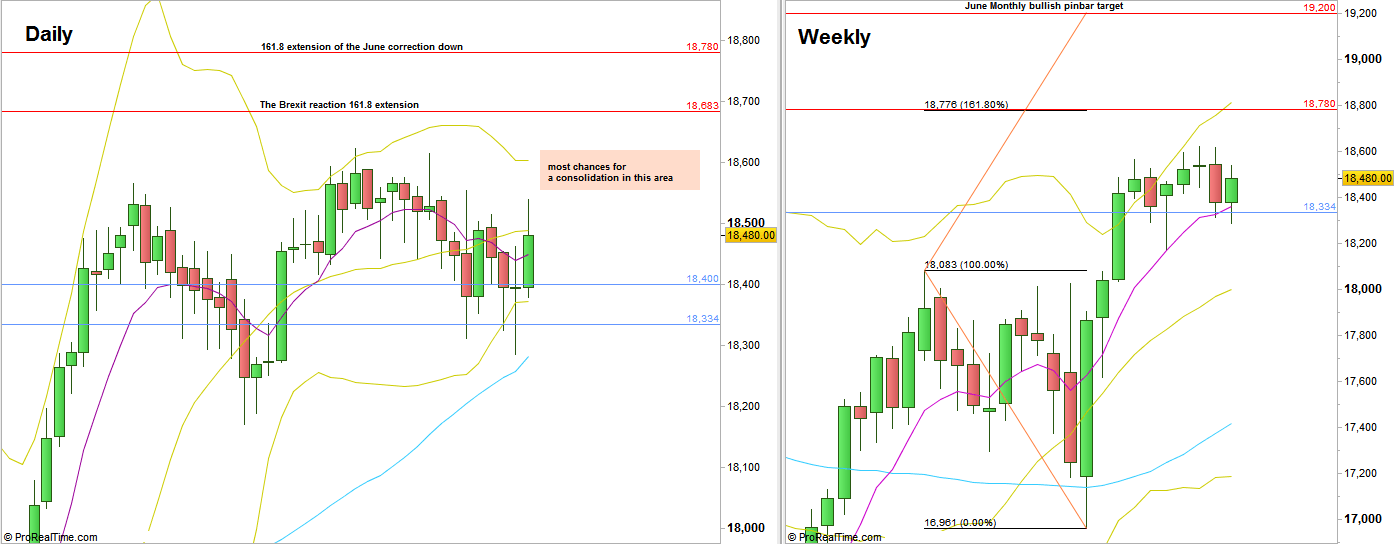
Dow Futures, Daily and Weekly charts – not by the same scale (at the courtesy of prorealtime.com)
Disclaimer: Anyone who takes action by this article does it at his own risk and understanding, and the writer won’t have any liability for any damages caused by this action.