
Like other stock indexes, the Dow wasnt different in a fairly strong bullish rally after just one more bearish day of digesting the Brexit news (last Monday).
The bearish setup targeted at the 16600 level area mentioned in the previous review is still valid, as long as the Quarterly High is still being respected. But, practically, a Weekly thrust up above last Friday’s High (taking out the High at 17903) considerably decreases the chances for this setup to work eventually, and in this case at any further decline the Weekly Low at 16961 should be respected as the last Low before going higher on the midterm.
The Monthly, Quarterly and Semiannual bars closed finally last Thrusday, all closed very strongly, way above the short term sentiment line, the 8 EMA for each of the timeframes, a strong picture indeed.
All three are now bullish pinbars, leaning on an upward sloping 8 EMA, a good signal to go long by taking out their Highs.
The market can still continue with the same sideway behavior for one more month, even two, testing again the Lows, but by most chances we should see sooner or later a remarkable break up that should take out the all time High at 18334.
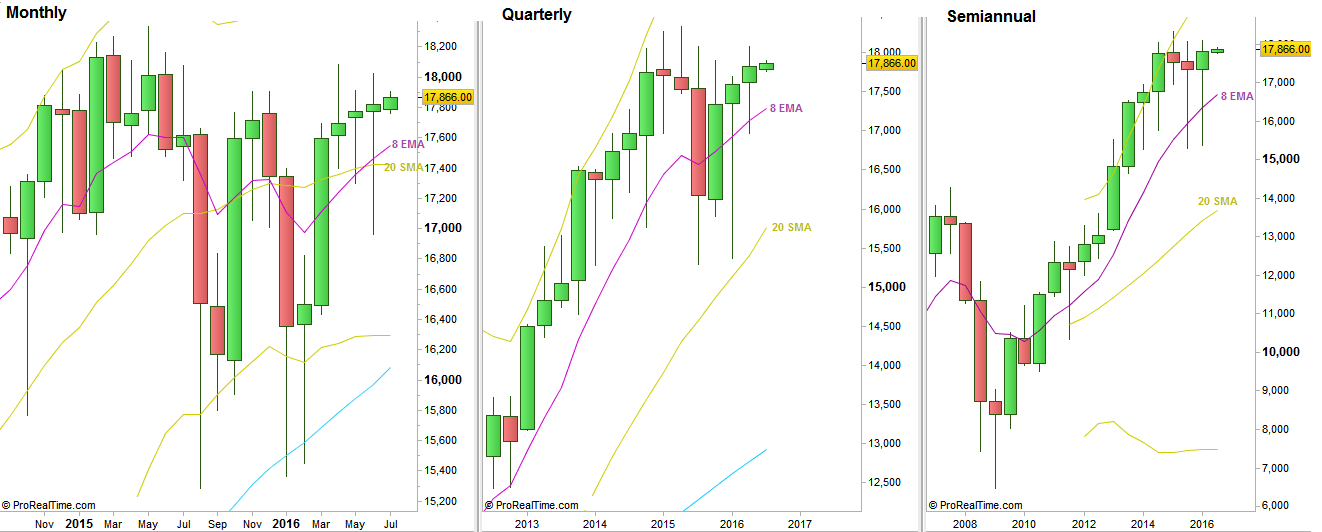
Dow Futures: Monthly, Quarterly and Semiannual charts (at the courtesy of prorealtime.com)
Disclaimer: Anyone who takes action by this article does it at his own risk and understanding, and the writer won’t have any liability for any damages caused by this action.