
The passing week changed the balance kept since the volatile moves at the beginning of September, and took out the Monthly Low at 17822.
This is a bearish signal to reach the down trend line taken out of the two last major Highs prior to the last bullish wave (see chart). However, This setup is going to be negated if the market takes out the High of the week before, at 18197, by this week or by the next one.
Since this setup is a counter trend setup, I wouldn’t give at this point much chances for it to reach its target. It would be more realistic at the moment to take out the Quarterly Low at 17618 and be supported on that area. 17596 is the 61.8% retracement level of the last major bullish wave since June (Brexit), and 17565 is the 100% projection of the last bearish correction since the all time High (see chart).
Since this coming week has already started with a quite a big gap up, deeply back inside the range, it is currently not a good spot to join a bearish move nor to look for signs of weakness, unless it occurs after closing that gap. This is a typical behavior prior to a near volatile event, such as the coming elections.
The Monthly bar of October ended as an inside bar. Any current swing bearish position with a stop above the Monthly inside bar’s High at 18320 or even the Weekly swing High at 18366 are prone to stop loss hit manipulations in volatile events.
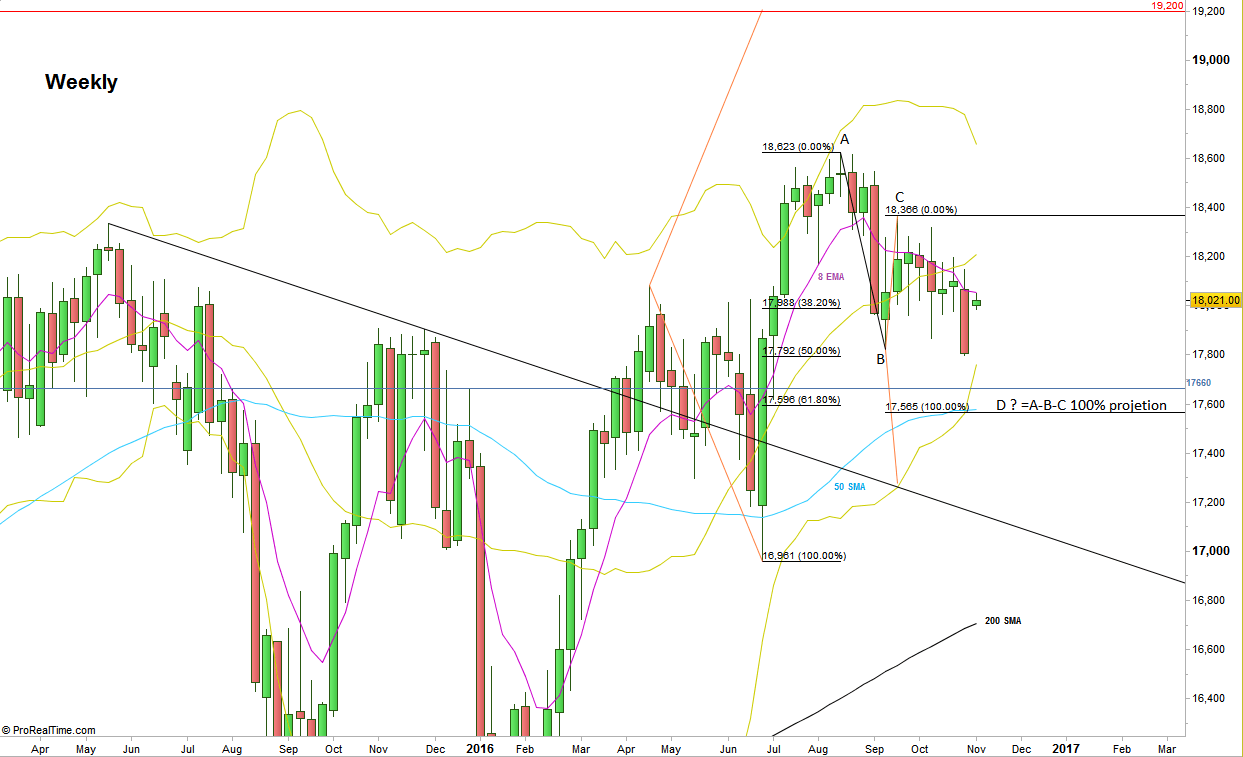
Dow Futures, Weekly chart (at the courtesy of prorealtime.com)
Disclaimer: Anyone who takes action by this article does it at his own risk and understanding, and the writer won’t have any liability for any damages caused by this action.