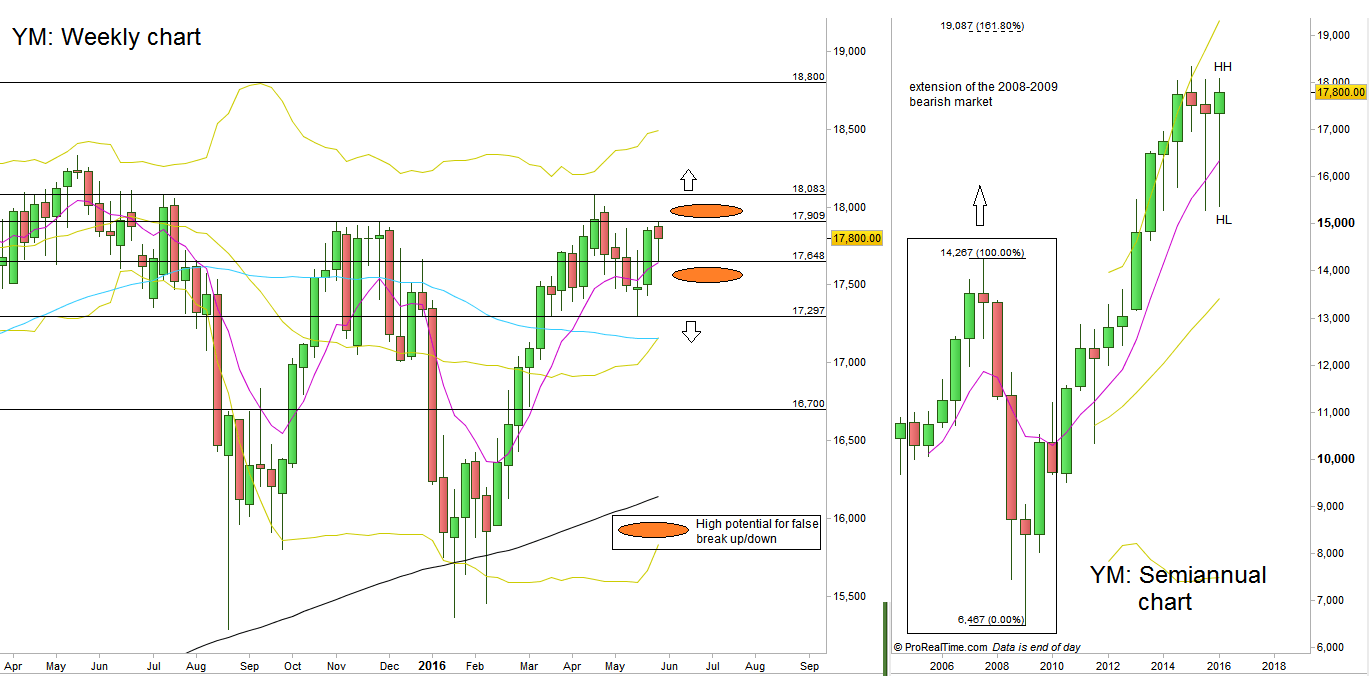
The month of May’s bar ended as a bullish pinbar on important moving averages having a slope in the direction of the trend, the 20 SMA (mid Bollinger Bands), and 8 EMA (short term sentiment), a very bullish picture, seen on chart1. Unlike the SP Futures, the Monthly High hasn’t been taken out yet. The Dow Futures are currently looking weaker than the SP Futures and the Nasdaq Futures in the short run, but the Dow’s Semiannual bar has already made a HH above the last Semiannual bar forming a HH HL bar, a clear sign of strength for the long term.
A good bullish scenario can emerge by taking out the Weekly swing High, which is also the current Semiannual High, at 18083, The target is by the same amplitude as the Weekly swing correction, i.e. at the 18800 area, above the all time High, pretty close (on the higher scale) to the 161.8% Fibonacci extension of the Whole 2008-2009 bearish market (see chart2, the Semiannual timeframe), at 19087.
Taking out the Daily swing High which is the Monthly High at 17909 has a lot of false thrust potential for this coming week, because of the lately Weekly bar price action. However, a false Daily thrust down in turn, that might even reach the 17500 area, then a reversal up and then taking out the Daily swing high at 17909 is a good bullish setup to take out the Weekly swing high, hence starting the above bullishness as a chain reaction scenario.
As for the bearish side, a clear bearish scenario can emerge by taking out the Monthly Low at 17297, currently not before. This can drive prices down to the 16700 area. Till the Monthly Low is hit, consider taking bearish signals only at timeframes lower than the Daily.
Disclaimer: Anyone who takes action by this article does it at his own risk and understanding, and the writer won’t have any liability for any damages caused by this action.


