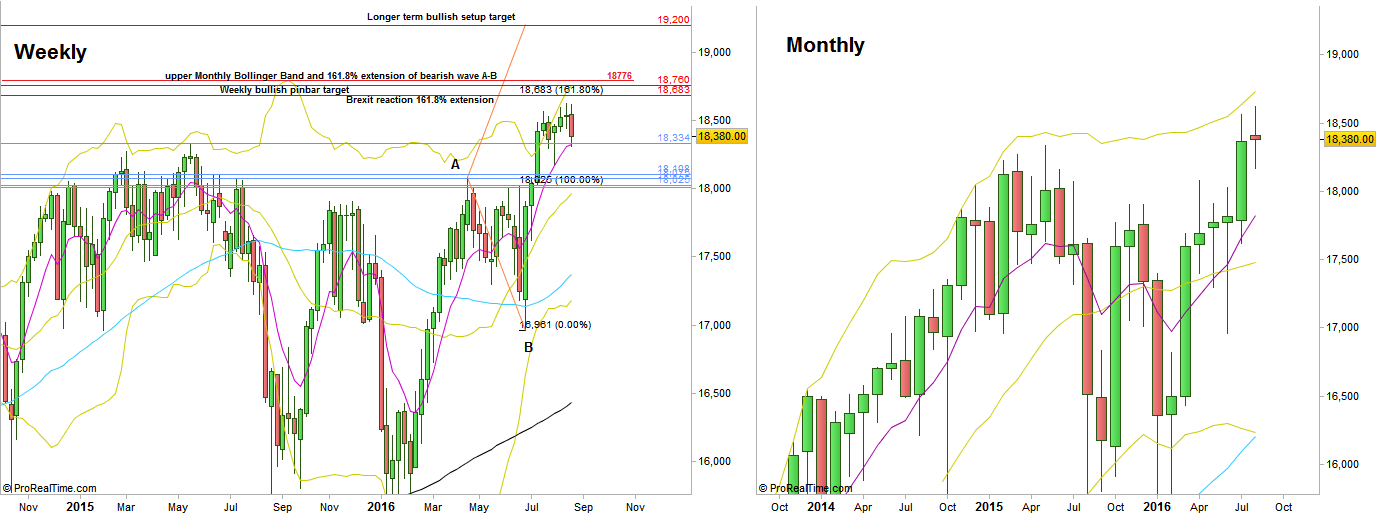
The Dow was the weakest among the main American indexes throughout the passing week. Unlike the others (SP500, Nasdaq and the Russel) it didn’t make a Weekly HH.
The monthly bar of August which is about to close in the coming week looks currently weak, rather far from the upper Bollinger Band, a loss of the strong momentum that has been demonstrated on July.
Yet, the Weekly bar is still supported above the Weekly 8 EMA, serving as the short term sentiment line, supported right on the previous all time High of May 2015 .
A bearish setup might develop is the market trading at the beginning of the coming week inside the range of last Friday, respecting it’s High (at 18554), where not before Wednesday takes out the Low of Friday. I wouldn’t give much chances for such a setup to succeed, reaching its targets.
Looking upwards, the main targets and resistance lines mentioned in the previous reviews – are still unchanged :
- The Brexit reaction extension of 161.8% at 18683.
- The Weekly bullish pinbar four weeks ago is still in play, target at 18760.
- Slightly above, the 161.8% extension of the last major correction that took place between last April to June, at 18776. This level is at the current Monthly upper Bollinger Band level.
- The long term bullish setup mentioned in the previous reviews, to reach 19200 area, current stop below the Weekly swing Low at 18170.
The fact that the market holds here, and probably leaves the next bullish thrust for September, raises the chances that the market is planning some stopping action for September, i.e. reaching the upper Bollinger Band (and the targets mentioned above at 18776), then reversing to close September rather weak.

Dow futures, Weekly and Monthly charts (at the courtesy of prorealtime.com)
Disclaimer: Anyone who takes action by this article does it at his own risk and understanding, and the writer won’t have any liability for any damages caused by this action.
