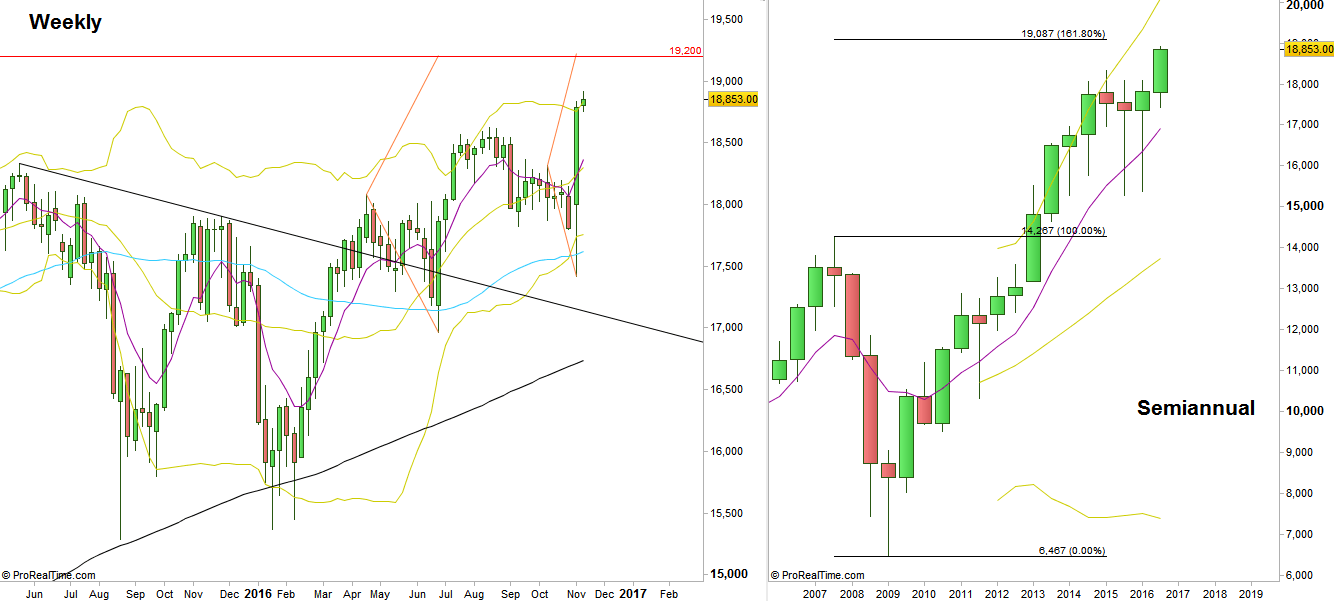
A very quite, relatively narrow range week has passed. Mostly sideways action and a clear shortening of the thrust on the Weekly chart.
However, the Weekly bars are stick to the upper Bollinger band, penetrating it considerably, and the price stays on the Highs. The Dow lately is one of the strongest stock indices.
In such cases as currently where the previous Weekly bar closed strongly penetrating the upper Bollinger band, and the passing week, although showing shortening of the thrust, -has made a new (all time) High, and continued penetrating the upper band, the bias needs to be stick to the upside. For example, taking out the Weekly Low is not a good signal to go short. If that happens, better wait for a false thrust down in such cases, and go long on new signs of strength.
The current most important bullish signal points to the 19200 level. Once the thrust down of the elections turned into a false thrust, and the High of October Monthly inside bar was taken out, this was a signal to reach the same magnitude to the upside, approximately the level of 19200.
This should remind us the previous bullish setup that points towards 19200 as well. (see the Weekly chart).
The most important resistance above is the 19080-19100 level area, (19087 is the 161.8% extension of the bearish market of 2007-2009 (Semiannual chart).

Dow Futures, Weekly and Semiannual charts (at the courtesy of prorealtime.com)
Disclaimer: Anyone who takes action by this article does it at his own risk and understanding, and the writer won’t have any liability for any damages caused by this action.
