
The passing week that was one of the more interesting weeks in the market for a long time, printed a big Weekly Upthrust bar by the end. That Upthrust would have been much more “severe” for the bulls had it first taken out the all time High. Since it started from within the Monthly range, below the Monthly swing High, not even to mention the all time High, we can not deduce that it probably should start a big bearish move to take out the Lows at the 15000 area(“a bearish market”), at least not due to this specific Weekly bar.
Friday’s bearish bar got supported exactly at the Daily 200 SMA and closed a bit higher, as well as above the Weekly 50 SMA. This subtlety shows us that most likely the market is not in a hurry to decline.
In the coming week the Monthly, the Quarterly and the Semiannual bars are going to close. The higher the timeframe, the more importance there is. Currently the Monthly is below the short term sentiment 8 EMA, bearish. The Quarterly HH HL bar has turned into a bearish formation, still a small range bar, but currently above its 8 EMA, and the Semiannual bar currently is and most likely going to close as a HH HL bar, way above its 8 EMA.
Since the market has taken out the Monthly Low at 17297, the bullish setup mentioned in the previous reviews has finally been negated.
In turn, Taking out this Low (at 17297) entered the market into a bearish setup that points to the mid big range, at the 16500-16600 area. This doesn’t negate consolidation and staying within the Weekly range for the next days if not the whole week ahead. In case the market does extend the Monthly bar down in the coming week, Expect 17020, at the current Quarterly 8 EMA level to be a strong support that might hold the price throughout this coming week from further declining directly into the mid range.
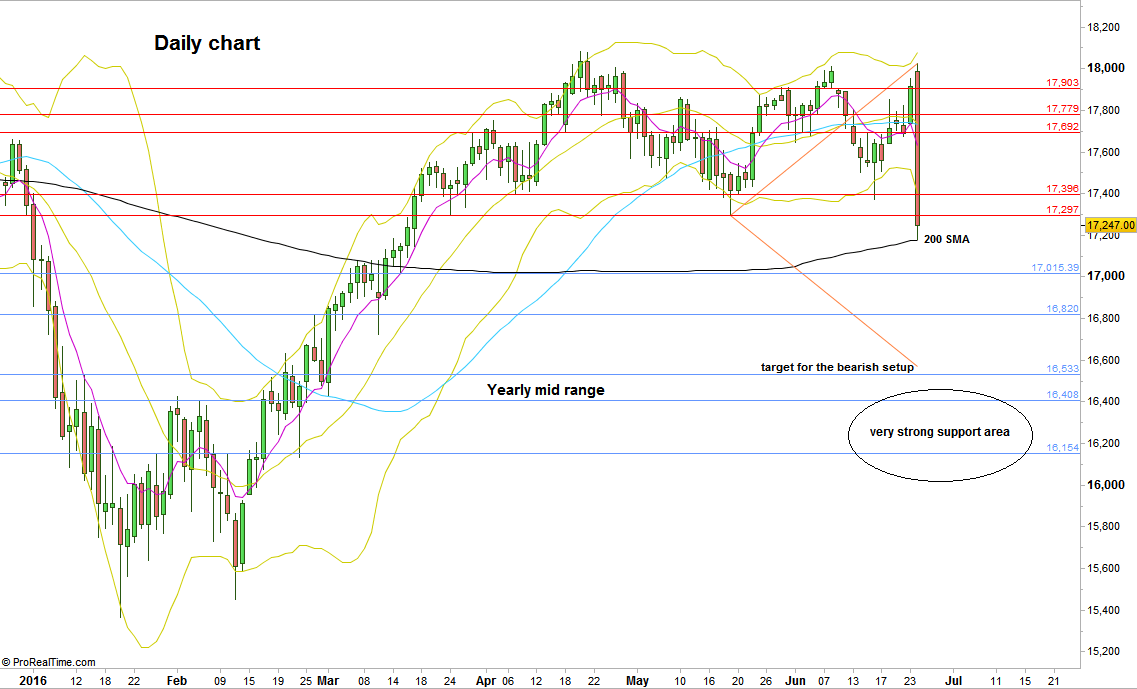
Dow Futures: Daily chart (at the courtesy of prorealtime.com)
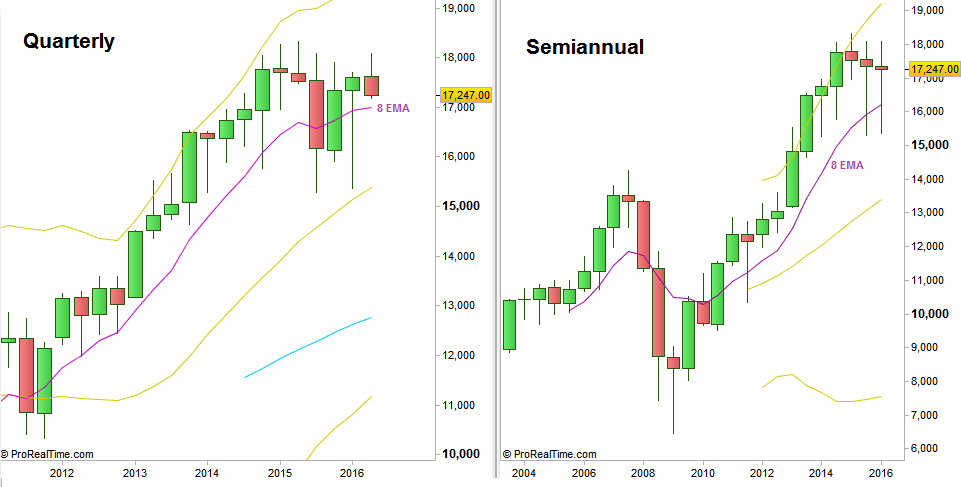
Dow Futures: Quarterly and Semiannual charts (at the courtesy of prorealtime.com)
Disclaimer: Anyone who takes action by this article does it at his own risk and understanding, and the writer won’t have any liability for any damages caused by this action.