
Before we get into the Weekly price action, I would like to show you a 2 year discrepancy between the DJ Industrials and the DJ Transportation indexes.
From the bottom of February 2016 both made the same percentage performance, approximately (45% ~) , but the issue is with the circled behavior. First, since the last Quarter of 2014. The Dow Transportation index has declined before the Industrials reversed down, and made a substantial move down, while the Industrials were trading mostly sideways (left circles). Second, for the last semi annual period a new discrepancy has been emerging as the Dow Industrials index is much stronger and very bullish while the Transportation index is trading mostly sideways (right circles).
By the Dow theory this divergence means that the current bullish wave is not created by a real economic recovery, and the transportation companies are not part of the “prosperity” the market has been showing lately, hence we may see currently the start of the extremity and the bigger scale topping action for the current bullish market (for the Monthly timeframe at least).
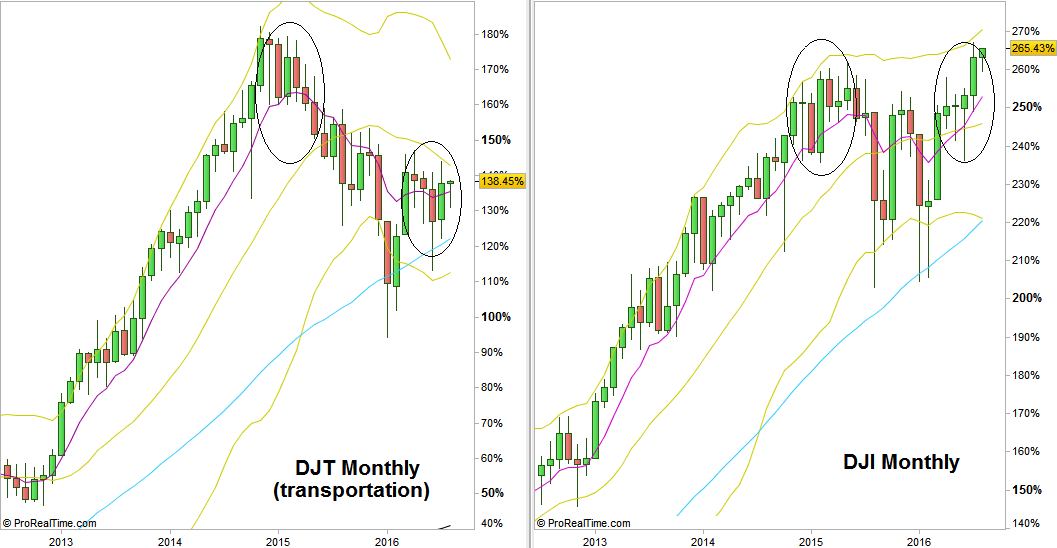
DJT-Dow Transportation (left) vs. DJI- Dow Industrials (right) Monthly charts
(at the courtesy of prorealtime.com)
Back into the Weekly Price Action, the passing week has printed a clear Weekly bullish pinbar, in which a thrust up above it -is a clear bullish signal to go Long. This Weekly pinbar is testing the previous all time High break up from above, and the thrust up above it’s High should most likely confirm the previous all time High’s break up. The first target for this pinbar is the same as its amplitude, i.e. 18760 level area. Within this distance there is also the 161.8% extension level for the Brexit reaction from which this current bullish wave emerged, at 18683, that can serve as an important resistance. The market is even in a bigger bullish setup to reach the 19200 level area, but currently the stop for the bigger setup can not be raised towards the last Weekly Low, not until a new all time High is being made.
By taking out the Weekly High, expect the price to take out the previous week’s High (and if it is very strong as seen – even the current all time High) as well before any Daily correction (that should be followed by the uptrend continuation).

Dow Futures, Weekly chart (at the courtesy of prorealtime.com)
Disclaimer: Anyone who takes action by this article does it at his own risk and understanding, and the writer won’t have any liability for any damages caused by this action.