
The Weekly bar closed as a small Doji inside bar, inner to the a wider range bar of the previous week that closed in the middle. This current behavior implies more sideways action for the rest of this month.
A small daily inside range signal can trigger if the coming week starts by taking out last Friday’s bullish pinbar’s High. The target for this signal is the Daily 50 SMA above, inside the Weekly range. In the same way’ a bearish signal might arrise if the prices do reach the Daily upper Bollinger band, and show signs of weakness immediately after (e.g. a Daily bearish pinbar).
The most important boundaries for the midterm direction haven’t changed. To be bullish midterm, prices need to close the open gap above 18468-18514, retrace and show new signs of strength. In order to be bearish midterm, prices need to take out the Monthly Low at 17822, where the target might be the down trend line taken from the previous all time High, lies at the 138.2% projection of the last Weekly bearish wave. As mentioned before, this is probably not going to happen before the end of October.
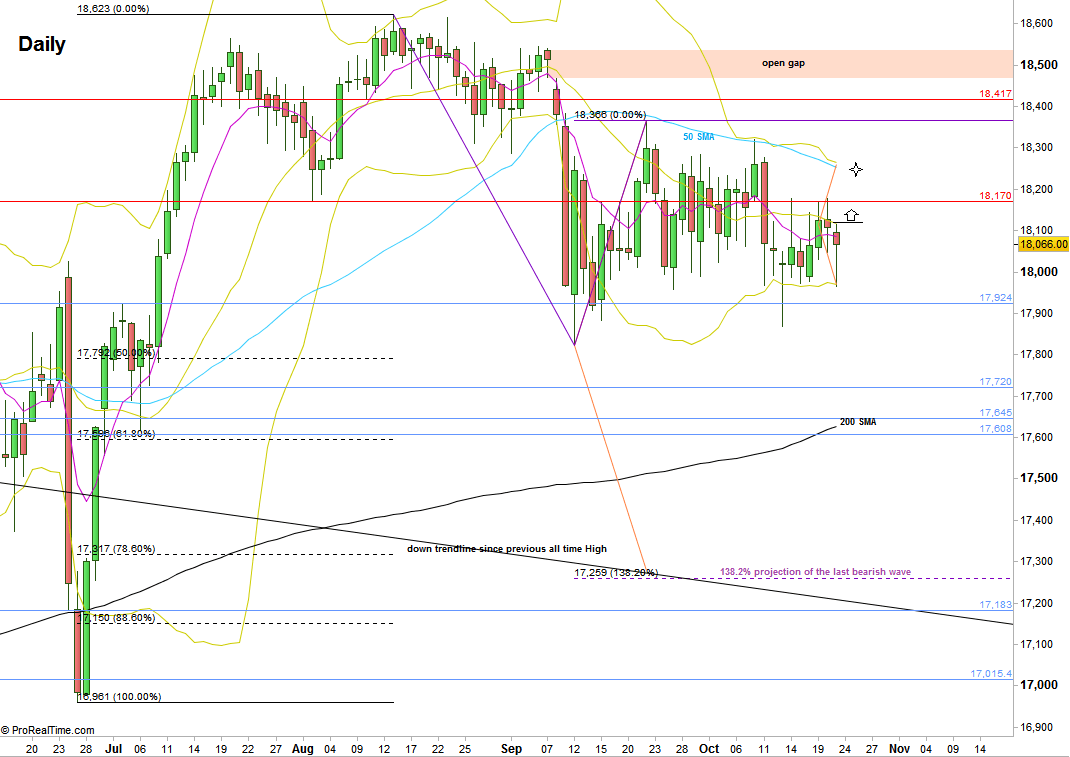
Dow Futures, Daily chart (at the courtesy of prorealtime.com)
Disclaimer: Anyone who takes action by this article does it at his own risk and understanding, and the writer won’t have any liability for any damages caused by this action.