The market closed the year with a minor retracement week. It was the first week for the past 8 weeks not to penetrate nor touch the Weekly upper Bollinger band.
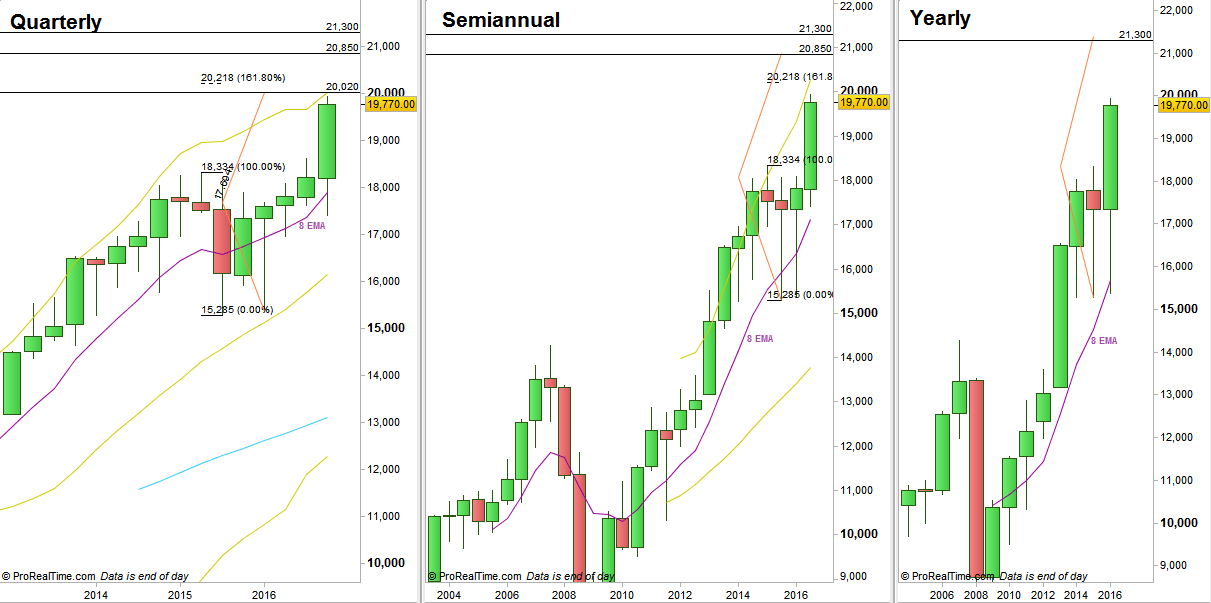
While on the Weekly and Monthly timeframes, everything looks very bullish, the important distinction is on the Quarterly and Semiannual timeframes. Eventually, the thrust of the passing bars for those timeframes didn’t manage to reach the upper Bollinger band – although being much closed to it, a fact that may be crucial – later on. It may indicate that the next major thrust (bar in terms of those timeframes) can be the last thrust for the current momentum (again, in terms of those timeframes), hence, may be ending this bullish market. Yet, remember the correct scale, and the next major thrust can have before a considerable move upwards (if/when).
The Quarterly pinbar of the first quarter 2016 has almost reached its target at 20020 (practically we may say it reached, and it relates to the distinction about the upper Bollinger band mentioned above).
Above that, The next important target is the election week’s Weekly Spring’s target at 20230, quite close to the 20218 level which is the 161.8% extension of the Whole retracement of the last 2 years.
Other longer targets are the last November Monthly spring, target at 21000, and the 2015 Yearly bullish pinbar on sloping 8 EMA, aiming for the 21300 area.
In order to take advantage of the last Daily bearish, refer to the open gap 19817 till 19877 first. Only after closing the gap, a retracement and a reversal pattern up can give us much more chances to see continuation of the Weekly uptrend.
This time, let’s have a look on the higher timeframe charts. Happy New Year !

Dow Futures, Quarterly, Semiannual and Yearly charts (at the courtesy of prorealtime.com)
Disclaimer: Anyone who takes action by this article does it at his own risk and understanding, and the writer won’t have any liability for any damages caused by this action.
