
The passing week was a typical week of this massive rally. On the Weekly timeframe the price action doesn’t seem to be stretched up, but on the Monthly timeframe it is. This is the 5th consecutive month to penetrate deeply the upper Bollinger band, very rare for this timeframe, and reveal the strength the market is demonstrating.
However, pay attention that most of the major targets around have been achieved, mainly the 20800-21000 levels being a target for both the Monthly and the Semiannual timeframe signals. On the Monthly it was the election Month that became a Spring (false thrust down and big thrust up), while on the Semiannual there were two consecutive bullish pinbars on sloping 8 EMA – of the 2nd half of year 2015 and 1st half of year 2016. The next major target is quite far currently, and it is the Quarterly Spring of last Quarter (again, created by the events of the last elections), pointing at 22400 as its target.
So, there isn’t any reason not to see a massive covering on these levels, that causes a correction or at least consolidation. But, it is not a good practice to focus on that, unless clear bearish signals emerge, fail (!) then eventually creating new signs of weakness.
Any decline towards the open gap created at the beginning of March prior to the massive thrust up, at 20807-20810 , keeping it open ending with a Daily sign of strength is a very good opportunity to join the current move on the Daily timeframe (preferably tightening stop orders below the Daily Low for the rest of the position after covering at least half of it on the 1:1 target being achieved).
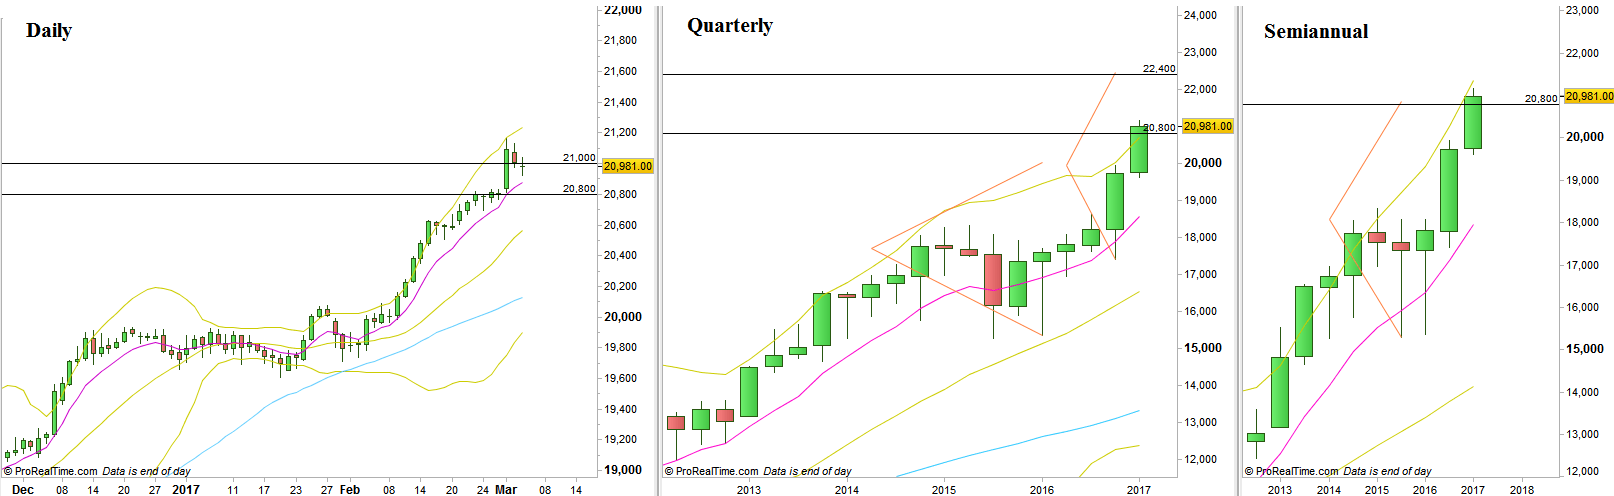
Dow Futures, Daily, Quarterly and Semiannual charts (at the courtesy of prorealtime.com)
Disclaimer: Anyone who takes action by this article does it at his own risk and understanding, and the writer won’t have any liability for any damages caused by this action.