
The sequence of six consecutive bullish Weekly bars has ended with a small bearish bar, but still an inside Weekly bar. Most of the price action throughout the passing week was held in relatively tiny Daily bars, in the shadow of the big Marabuzo Daily bar that printer on the 1st day of the month. A tiny but important open gap below that day (20807-20810) was finally closed, rejecting this gap as a “runaway gap”. The reversal attempt to go up has failed as well last Friday, with a Daily bar closing below the 8 EMA, but still supported by the 20 SMA.
On higher timeframes, the market is very tensed upwards. The Quarterly bar has penetrated the upper Bollinger band, and the Monthly bar is still completely outside the upper Bollinger band (!) as well as being the 5th Monthly bar to penetrate the upper Bollinger band (!)
As already mentioned, most of the major targets around have been achieved, mainly the 20800-21000 levels being a target for both the Monthly and the Semiannual timeframe signals. On the Monthly it was the election Month that became a Spring (false thrust down and big thrust up), while on the Semiannual there were two consecutive bullish pinbars on sloping 8 EMA – of the 2nd half of year 2015 and 1st half of year 2016.
Further weakness can be revealed for the coming week. Taking out the Low of Last Thursday at 20781 which is the inside Weekly bar’s Low is a setup to decline and test the next Daily open gap 20588-20602 – but that shouldn’t be a good practice shorting the market on a Daily and above timeframes, and the above setup can eventually end up as a false thrust down.
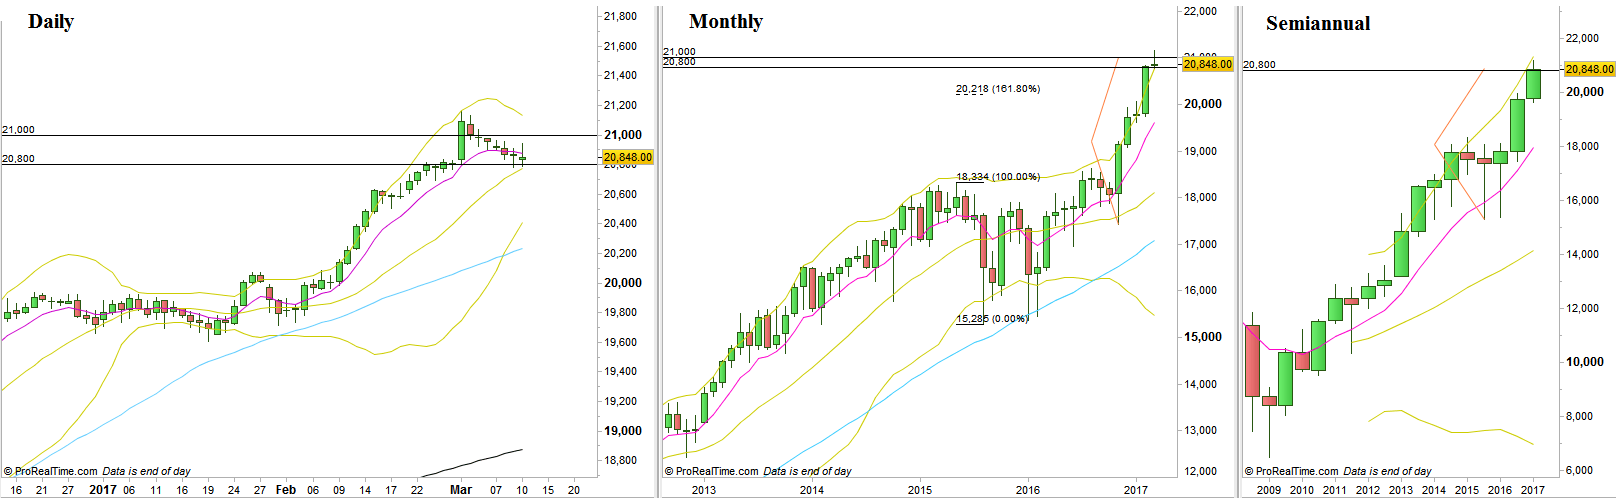
Dow Futures, Daily, Monthly and Semiannual charts (at the courtesy of prorealtime.com)
Disclaimer: Anyone who takes action by this article does it at his own risk and understanding, and the writer won’t have any liability for any damages caused by this action.