
Opposed to the previous Weekly bar which was an inner bar to the Daily bar of Friday, September 30th, – the passing week has extended that same Friday’s bar to both sides. The market extended upward by a false thrust up that stalled on the Daily 50 SMA, and so far the extension down has been a false thrust as well.
Most of the passing Weekly move was bearish. True that the upthrust at the beginning of the week gave more validity for the midterm bearishness of the market, but by the rest of the week, the market doesn’t seem to hurry downward at all.
The Daily bars of last Tuesday and Wednesday didn’t manage to touch the lower Bollinger band, and the penetration of the lower band that took place on Thursday – finally turned out to be a bullish pinbar. The last move on last Friday ended weak, but not weak enough (by the price action behavior) to get ready for a considerable bearish move, and in fact there are more chances to see the price reaches the Thursday bullish pinbar’s target at 18230.
This behavior may print for the coming week a Weekly inside bar, or a bar which is inner to the current Weekly range, rather than taking out the Monthly Low at 17822, neither dealing with the Highs above (the Weekly swing High at 18366 and the open gap at 18468-18514).
However, taking out the Monthly Low at 17822 is a bearish signal to reach the 17200 area, lying on the down trendline taken from the previous all time High and the successive swing High right after.
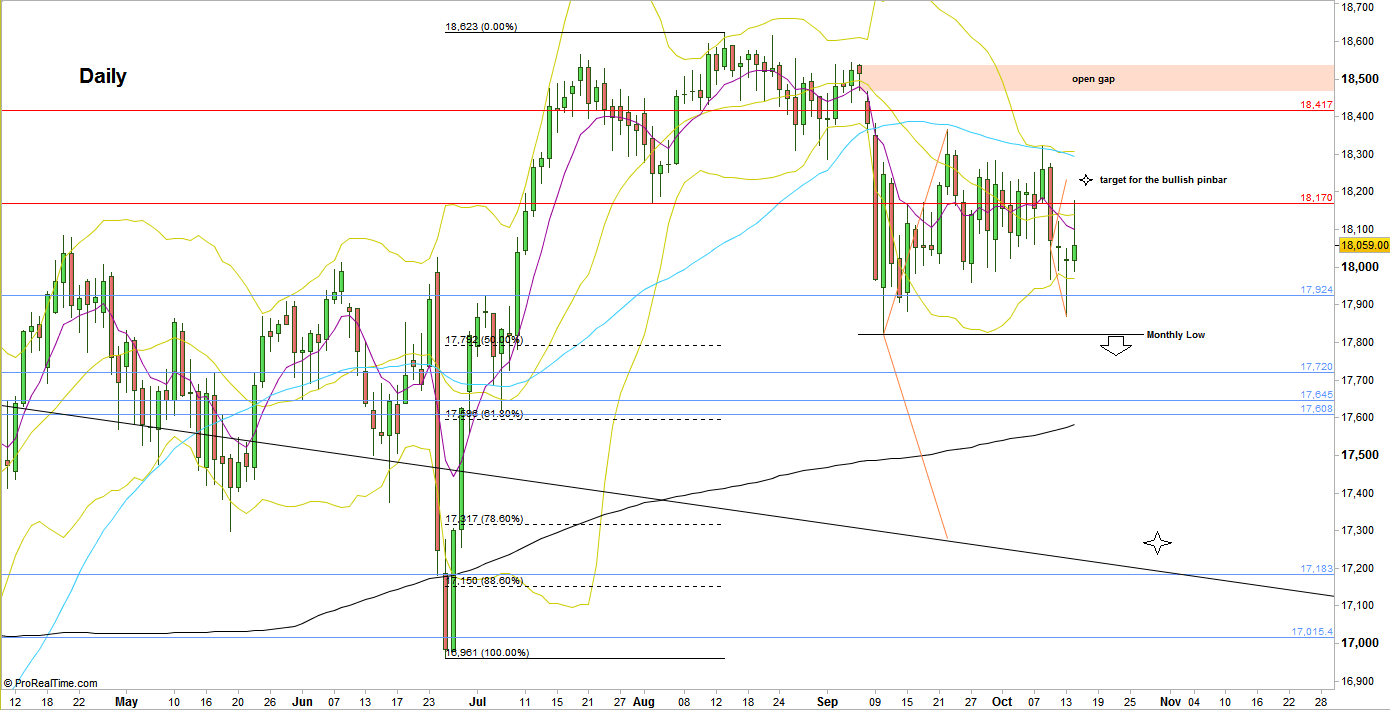
Dow Futures, Daily chart (at the courtesy of prorealtime.com)
Disclaimer: Anyone who takes action by this article does it at his own risk and understanding, and the writer won’t have any liability for any damages caused by this action.